
Before starting the design and development of the features, it is always prudent to lay out its graphical interface if the application is supposed to have it. This allow to set with great precision the needs in terms of services to build, as well as necessary information needed in and out of these services.
Starting with the development of services without having a clear vision of what can make the application in terms of user functionality often causes the writing of unused or unsuitable code.
Our GUI must meet business use cases discussed while providing an ergonomic, giving urge the user to use the application.
When the developer is also the user of the application, the ergonomic aspect is of course easier.
As a reminder, we have several business use cases and one technical use case. The technical use case does not require the use of a GUI, so, here, we put it aside and focus us on other cases.
Reminder, here is the use case diagram:
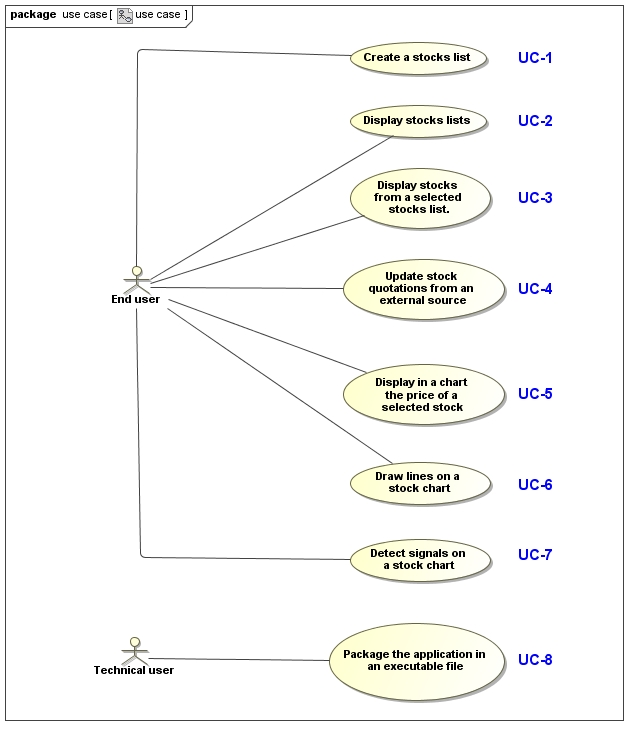
- UC-1 Create a stocks list
- UC-2 Display stocks lists
- UC-3 Display stocks from a selected stocks list.
- UC-4 Update stock quotations from an external source
- UC-5 Display in a chart the price of a selected stock
- UC-6 Draw lines on a stock chart
- UC-7 Detect signals on a stock chart
- UC-8 Package the application in an executable file
The idea is to focus 100% on use cases when we design a GUI.
- The stock : the UCs’s key element.
By reading Business UCs, 3 business concept emerge:
– stock lists (UC 1, 2, 3)
– stocks (all Business UC)
– stock price (UC 4 and 5)
We notice that the stock is omnipresent while the stocks lists and the stock price are specific to some use cases.
However, by thinking about it, it is quite logical that the central element in a stock trading application is stock. In the end, the user is studying stocks, buying stocks, selling stocks, etc …
Around the stock, the rest gravitates: its location in one or more lists, its price, its visualization, etc …
In a full trading application, this fact is still true: the stock and more generally the value remains at the center of attention.
How to use this information?
In striving to design a graphical interface and treatments that will put the stock share in an ideal position.
Ideally, the user wants to quickly and easily display the stock chart. He would also be able to go from one action to another easily.
We imagine it would be relevant to implement the use cases 2 (Show action lists), 3 (Show stocks of a selected list), 5 (View in a chart the course of action selected), 6(Draw lines on a stock chart) and 7(Detect signals on a stock chart) within a single visual display to allow the user to have all necessary information on the same page and thus save time. And that’s what we’ll do.
Then in our application, the root action that can make a user on an action is its being displayed on a graph. So why not link the selection of the action from the list to update the graph showing the action?
Finally, add shortcuts to search action also seems a good idea.
With these visual and ergonomic adjustments, the action will take the place it deserves.
2. UCs visual organization
As discussed in the previous section, we will ensure to meet the use cases 2, 3, 5, 6 and 7 in the same visual display.
These 5 UC being the most widely used UC in the life of the application, we must make its as enjoyable and easy usable as possible.
UC 2, 3, 6 and 7 do not require a significant part of the space occupied on the screen, we can put them on the side in a vertical way.
On the contrary, the UC 5 requiring much space will carve the lion’s share by occupying about 80% of the width of the screen.
Finally, the two other UC (1. Create a stocks list and 4. Update stock quotations from an external source) due to the different nature of their subject and their much lower frequency of use, are more appropriately elsewhere.
Regarding the UC 1 (Create a stocks list), we will see that it will not be necessary to implement it in our application.
As for the UC 4 (Update stock quotations from an external source), we will make it accessible via a dedicated screen, accessible from the « Options » menu.
3. Draw the backbone of the main screen.
You can make the backbone of your main screen with a drawing tool or directly with Swing. It does not matter. The aim is to achieve a visual consistent with the target.
In the following screenshot, I did this with Swing.
